Sex Discrimination in the Workplace

The #MeToo movement may have been prompted by misconduct in Washington and Hollywood, but its ramifications can be felt nationwide. From medicine to hospitality, a range of industries are confronting the harassment of female workers – and struggling to identify lasting solutions. Clearly, the moral requirements of the American workplace are being rapidly redefined. But even against this backdrop of broader change, it takes true courage to raise such concerns in one’s own workplace. Are more people now standing up against discrimination and harassment at work than in decades past?
We set out to study this subject, gathering 20 years of U.S. Equal Employment Opportunity Commission data related to discrimination on the basis of sex. Our findings reveal how charges of this kind have risen and fallen over time and where they occur most often across the country. Additionally, we’ve analyzed how often such complaints succeed and the monetary benefits that result. To learn how people are combating sex bias where they work, keep reading.
Sex Discrimination Geography
To investigate regional patterns of sex-based discrimination, we first examined the distribution of such charges by state in 2017. Our data indicate a clear concentration of EEOC complaints of this nature in Southern states. This trend was particularly visible in Mississippi and Alabama, which each averaged more than 18 complaints per 100,000 residents. Notably, those two states have no equal pay laws requiring employers to compensate men and women equally for the same work, and residents might be more likely to utilize the EEOC’s federal protections accordingly.
Interestingly, however, Washington, D.C., had the highest concentration of sex-based discrimination complaints overall. The city has certainly found itself at the center of the #MeToo maelstrom, as powerful politicians on both sides of the aisle have found themselves accused of misconduct. Conversely, some less populous places had very few complaints in 2017. Wyoming, Maine, and Montana, for example, had less than 10 total complaints apiece.
Discrimination Through the Decades
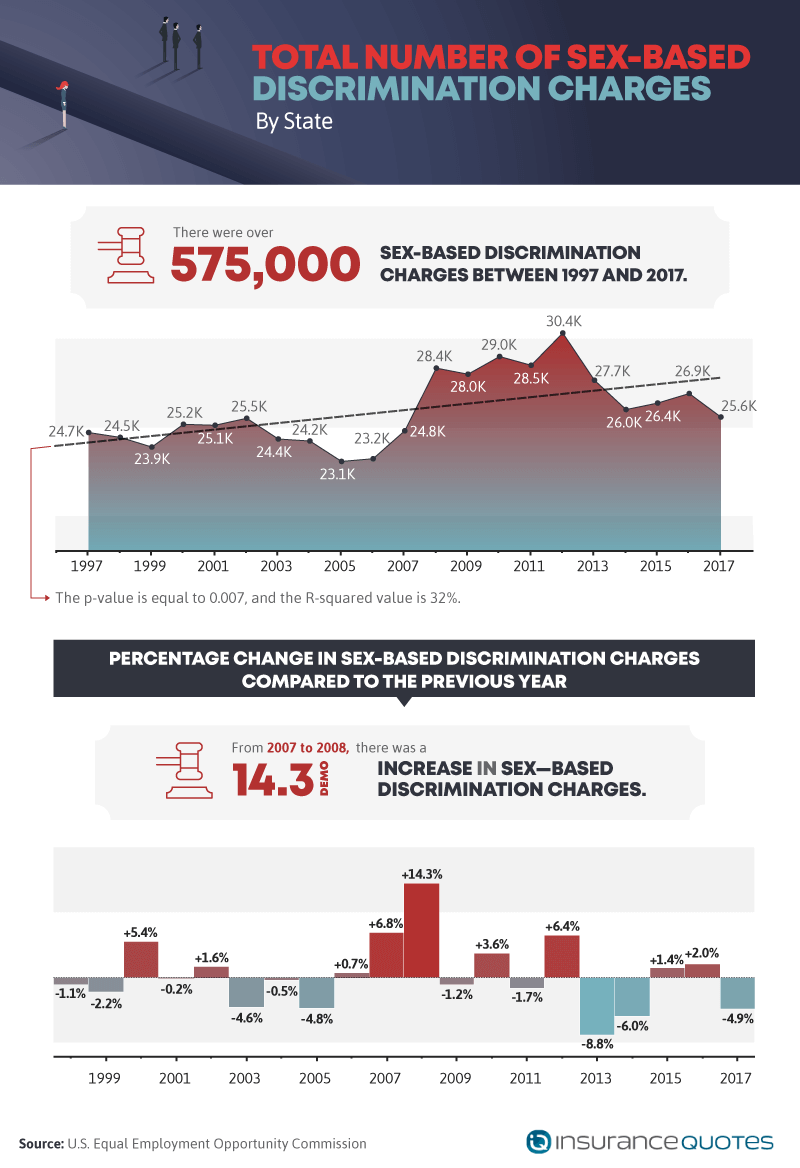
Over the last two decades, has the volume of sex-based discrimination charges substantially increased or subsided? Our findings do suggest a general rise in charges between 1997 and 2017, but also distinct periods of increased and diminished activity. Between 2006 and 2009, for example, sex-based discrimination complaints increased substantially. This trend may have been encouraged by the Supreme Court’s 2006 ruling in Burlington Northern & Santa Fe Railway Co. v. White, which established broad anti-retaliation protections for those who filed such complaints against their employers.
Sex-based discrimination charges peaked in 2012 but declined in subsequent years on record. The most substantial recent drops came in 2013 and 2014 when complaints declined by 8.8 and 6 percent respectively. Interestingly, complaints also declined in 2017, despite that year’s torrent of reports of celebrity misconduct that would soon propel the #MeToo movement to prominence. Perhaps because such stories emerged in the final months of 2017, their true impact will be reflected in 2018’s complaint figures instead.
Improvement Over Time?
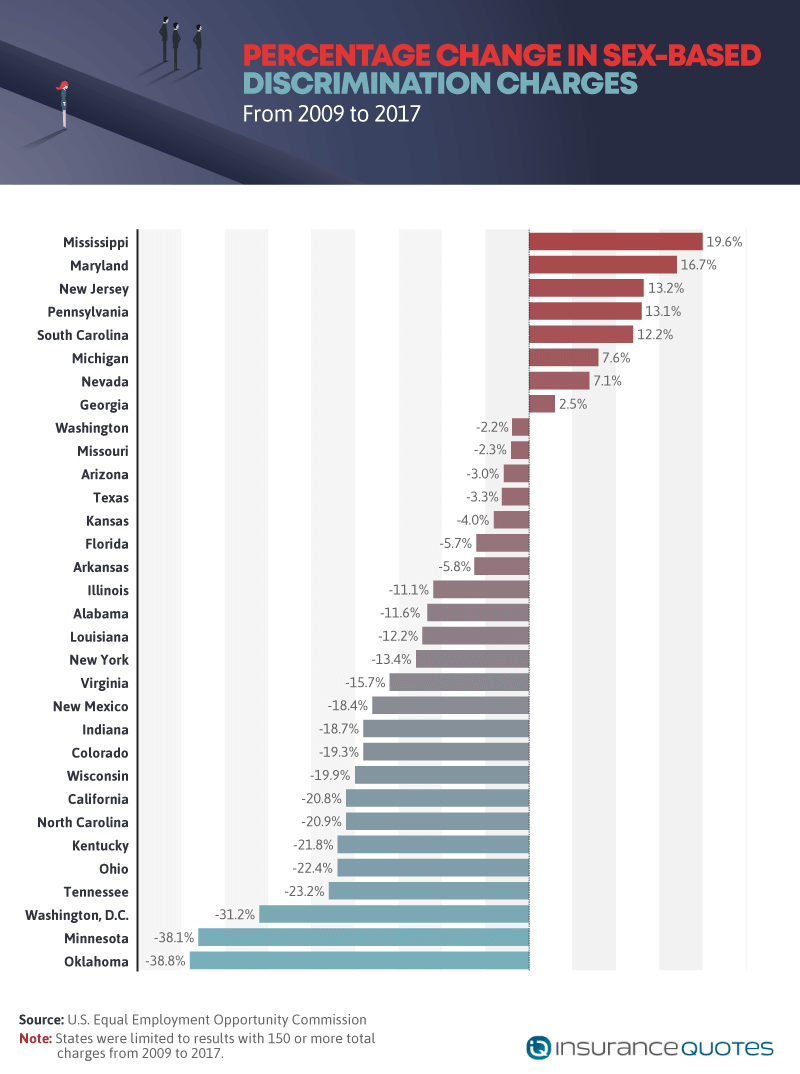
We also compared 2009 and 2017 data for each state specifically, gauging where sex-based discrimination complaints increased over that period. For all but eight states, complaints declined in the last eight years. Indeed, Minnesota and Oklahoma seemed to demonstrate exemplary improvement, with their complaint totals decreasing roughly 40 percent apiece. Even Washington, D.C., which had the highest per-capita rate of complaints in 2017, saw far fewer sex-based discrimination charges than in 2009.
Yet some places were home to an unsettling increase: Mississippi saw charges surge nearly 20 percent between those years, and Maryland’s total rose by almost 17 percent. Maryland lawmakers have recently made efforts to improve workplace protections from harassment, passing the Disclosing Sexual Harassment in the Workplace Act in 2018. It’s worth noting, however, that an increase in charges doesn’t necessarily indicate harassment has become more prevalent. Instead, such a shift could signal workers are newly willing to challenge long-standing injustices and making use of the EEOC to do so.
Conclusions and Compensation
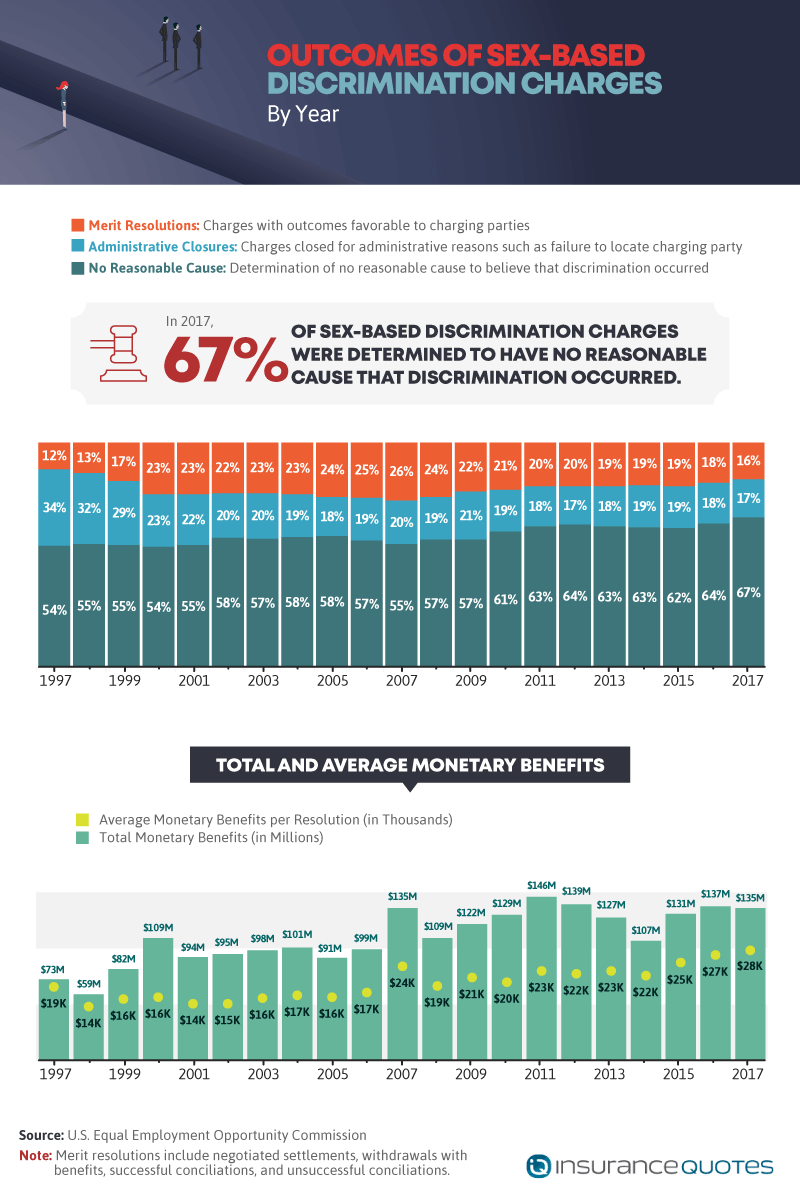
Turning to the outcomes of these sex-based discrimination charges, we find the percentage of complaints closed with a finding of “no reasonable cause” to suspect discrimination has increased in recent years. In fact, over two-thirds of complaints ended with this determination in 2017, whereas merely 54 percent did so in 1997. Thankfully, however, the percentage of complaints halted by logistical challenges has significantly declined. In 1997, roughly a third of charges ended in “administrative closures” for reasons such as difficulty locating the person who filed the complaint. Since 2010, less than 20 percent of charges have ended in administrative closures – perhaps because the internet makes finding and communicating with complainants much simpler.
In cases in which discrimination is identified, however, the typical monetary settlement has steadily increased over time. Although some of this surge is likely attributable to inflation, the increase is encouraging. In 1997, sex-based discrimination charges resulted in a modest $73 million in total compensation, with an average award of just $19,000. In 2017, such charges resulted in $135 million in total benefits or an average of $28,000 per complaint.
Alleged Acts
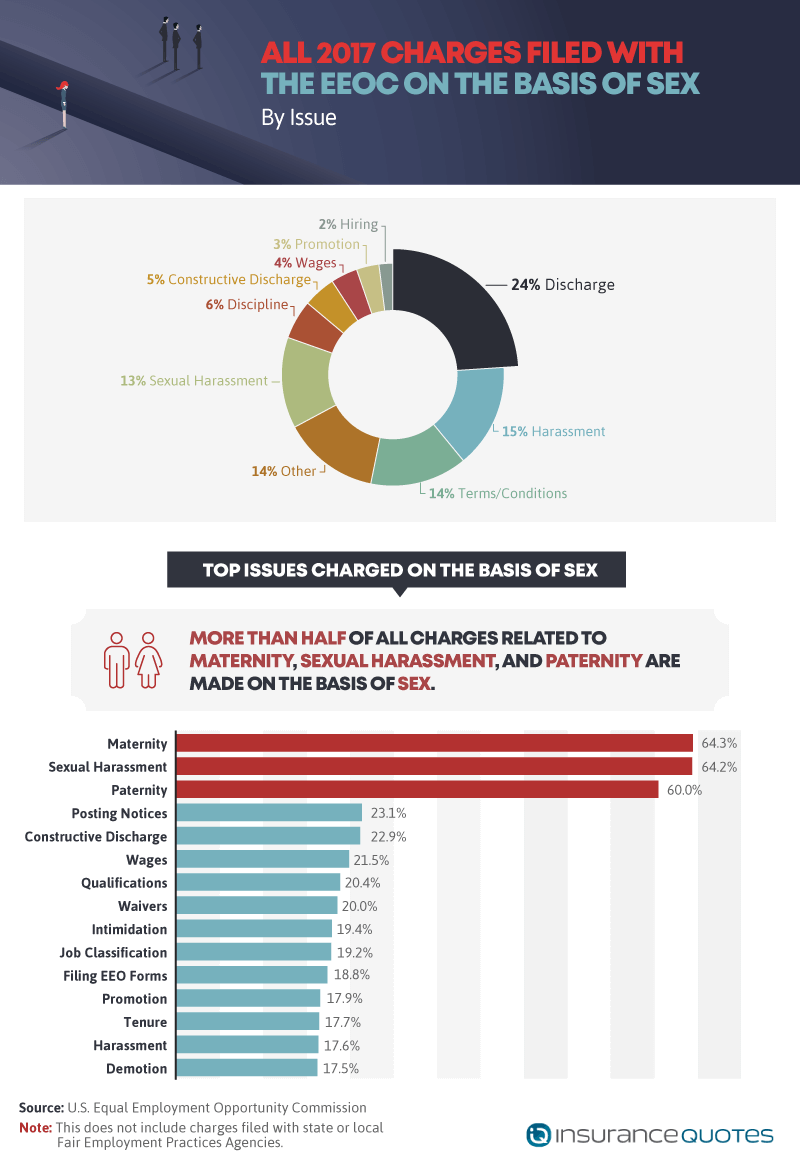
Within the broad category of sex-based discrimination, which forms of harassment and prejudice do American workers report most often? In 2017, nearly a quarter of complaints involved individuals alleging they had been fired unfairly on the basis of their sex. Harassment represented another 15 percent of charges, and 14 percent fell into a category of complaint the EEOC titles “terms and conditions.” This segment of charges refers to allegations that an employer took gender into account when making decisions about employment, payment, or promotion – and might contribute to the underrepresentation of women in corporate leadership.
We also considered charge data in another light: For each form of workplace discrimination the EEOC records, what percentage of complaints arise from sex-based discrimination specifically? Of complaints citing maternity and sexual harassment, nearly two-thirds were made on the basis of gender. Sixty percent of paternity-related discrimination complaints were made on the basis of gender as well. A case of this kind made headlines in 2017 when an employee of JPMorgan Chase alleged his paternity leave benefits should be equal to what female employees receive for maternity leave.
Pace of Progress
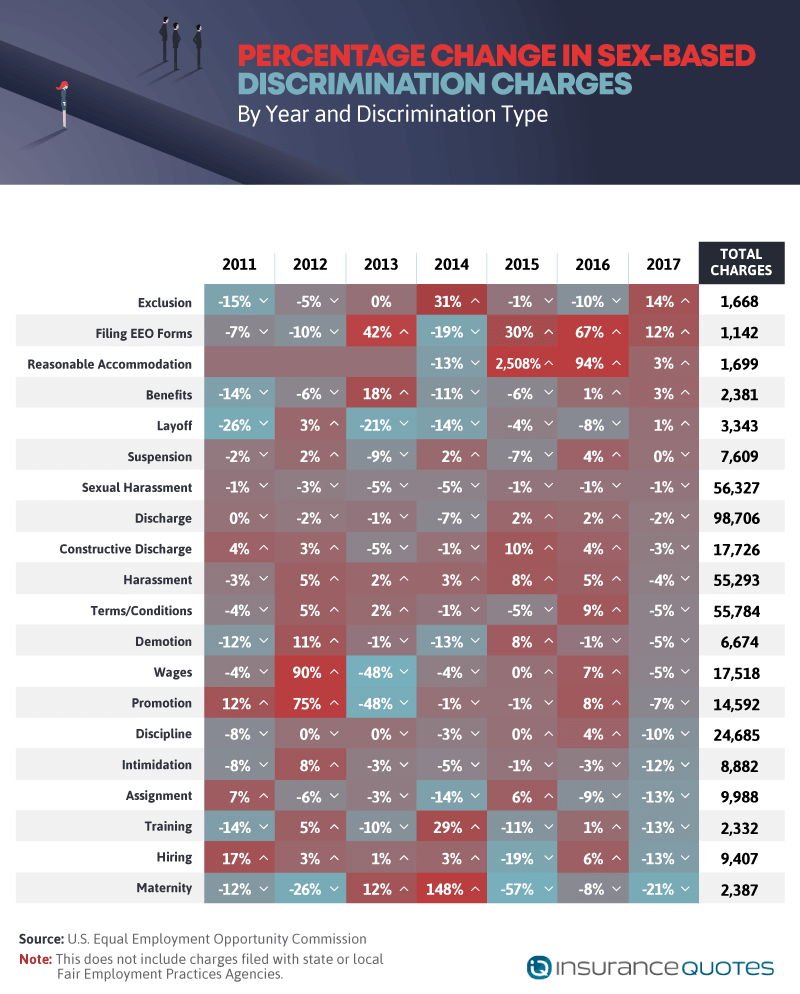
Have certain forms of discrimination become more prevalent in recent years? On a year-to-year basis, at least, we find compelling instances of sudden change. In 2015, for example, reasonable accommodation charges made on the basis of gender surged over 2,500 percent. This massive upswing could relate to a 2014 EEOC guidance in which the agency urged employers to better accommodate breastfeeding mothers.
As far as improvement, 2017 offered a few encouraging statistics, including a 21 percent dip in maternity discrimination charges. But such trends have proved short-lived in the past: In several instances, figures seemed to rise in one year and reverse in the next, or vice versa. In 2012, for example, charges alleging wage and promotion discrimination soared 90 and 75 percent respectively. The very next year, these charges each declined 48 percent.
Inspiring Courage
Our findings entail a striking number of complaints recorded over a 20-year period. But our figures account for a mere fraction of the discrimination and harassment incidents that actually took place during that time. Experts estimate that roughly three-quarters of harassment incidents go unreported, in part because those who raise such concerns are often subjected to retaliation. When we consider the charges presented above, its natural to feel sadness and anger about what American workers have experienced. But we should also pause to appreciate the bravery of those who oppose injustice – no easy task in any workplace.
If you’re a small business owner, we know you strive to create a company in which all workers feel safe to succeed. Don’t let unexpected risks destroy the business and culture you’ve built. With expert business insurance agents and industry-best prices, our team can help you navigate the landscape of liability. We’ll handle the stressful stuff, so you can stay focused on growth. Visit insuranceQuotes.com to learn more.
Methodology
We collected data from the U.S. Equal Employment Opportunity Commission for enforcement and litigation statistics made on the bases of sex. Data were accessed on Feb. 20, 2018.
Sex-based charge receipts reflect data from 1997 to 2017. The data do not include charges filed with state or local Fair Employment Practices Agencies.
“The number for total charges reflects the number of individual charge filings. Because individuals often file charges claiming multiple types of discrimination, the number of total charges for any given fiscal year will be less than the total of the ten types of discrimination listed.”
For data related to outcomes of sex-based discrimination charges, merit resolutions include negotiated settlements, withdrawals with benefits, successful conciliations, and unsuccessful conciliations.
No statistical testing was performed, so the claims listed above are based on means alone. As such, this content is purely exploratory.
Fair Use Statement
If you’d like to help us spread the word on the prevalence of workplace discrimination, feel free to use and share our content for noncommercial purposes. If you do, please include a link to this page to attribute us appropriately and let your readers explore this project in its entirety.
- About the Author
- Latest Posts

Brian O’Connell is a nationally recognized financial journalist, best-selling author, and former Wall Street bond trader with over 20 years of experience. He is the author of The 401(k) Millionaire and CNBC’s Creating Wealth, and has contributed to The Wall Street Journal, U.S. News & World Report, Forbes, CBS News, and TheStreet.
