Repair and Replace: How Safe Are the Bridges in Your State?

Do you drive across a bridge every day on your way to work? Maybe you journey across a bridge to get to a supermarket, restaurant or a family member’s home?
If so, then here’s a statistic to make you nervous: According to the American Society of Civil Engineers, about 56,000 of the U.S. bridges were considered structurally deficient in 2016.
It’s important to realize that these bridges aren’t necessarily in danger of collapsing during your next drive over them. If officials believe there is any danger of that, they’re expected to shut the bridges down to traffic. The goal is not to have them fall into such disrepair in the first place.
That’s not as easy as it sounds, though.
RELATED: How Much Will Bundling Your Insurance Save You?
When a bridge is structurally deficient it is definitely in need of repair. This costs money, of course, which can impact state budgets. Officials might also have to impose weight restrictions on bridges that need serious repairs. This can steer trucks, buses, tractors and other heavier vehicles away from these bridges, increasing traffic congestion on other roads and causing shipping delays.
It’s important, then, for governments to find the funds necessary to repair these structurally deficient bridges before their conditions worsen.
Aging infrastructure needs to be addressed
 Figures from the American Road & Transportation Builders Association on the locations of structurally deficient bridges across the United States were recently analyzed by insuranceQuotes. Included in this analysis was how many people cross these bridges daily and the structures’ ages.
Also looked at were the states spending the most to repair old bridges.
Here are some interesting highlights from the analysis.
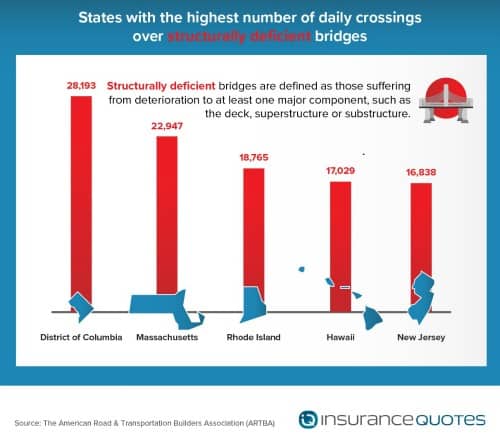
Washington, D.C., actually has the fewest structurally deficient bridges in the country. But the deficient bridges the city does have happen to be the busiest in the nation.
According to the American Road & Transportation Builders Association, D.C. had more than 28,000 daily crossings over its structurally deficient bridges. That figure led the country.
A good example? The Arlington Memorial Bridge. This 84-year-old bridge in 2016 received some much-needed repair work from the National Park Service.
But the Associated Press reported that these repairs would only prolong the life of the bridge by five years.
The National Park Service estimates that the iconic bridge needs to be completely rebuilt, a project that will cost about $250 million. If this doesn’t happen, that the park service says the bridge will be closed by the year 2021.
There is hope that the bridge will be saved. In February of this year, the National Parks Department issued a press release saying it had finished planning for the rehab of the bridge and is now moving onto the design phase of the work.
CHECK OUT: Why You Should Raise Your Auto Insurance Deductible
The park service is working to gather funds for the project.
Farther north, drivers traveling through Massachusetts and Rhode Island will make plenty of crossings over deficient bridges, too. Massachusetts had the second highest number of crossings over structurally deficient bridges in 2016 with nearly 23,000 daily. In Rhode Island, this number was 19,000, third on the list.
North Dakota ranked on the other end of the scale, with only 175 daily crossings over structurally deficient bridges in 2016. Coming in second was Iowa, with 271 daily crossings, while Kansas ranked third with 284.

Average U.S. bridge is over 40 years old
The American Road & Transportation Builders Association says that the average bridge built in the United States is 43 years old.
That’s not too bad, considering that most contemporary bridges are designed to last for 50 years before they need major repairs.
Here’s the news that may be unsettling: According to the association’s data, more than 100,000 bridges in the United States are at least 65 years old. That’s a sign that the country’s transportation infrastructure is aging, and needs some serious investment.
In Texas, the bridge that was the busiest and most structurally deficient was built in 1991. That’s the youngest in any state. At the opposite end? Vermont’s busiest and most structurally deficient bridge was built in 1928.
Minnesota and North Dakota weren’t far behind. Those states most structurally deficient and busiest bridges were each built in 1938.
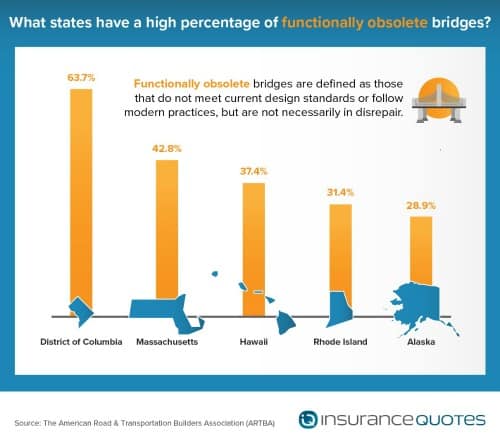
What is a functionally obsolete bridge?
 There are also many bridges in the United States that are considered functionally obsolete. These bridges need repairs, but aren’t considered dangerous.
National Bridges, a national bridge inventory database, defines obsolete bridges as being those that no longer can adequately carry out their specified tasks.
For instance, a bridge might not have enough lanes to accommodate the traffic moving along it. A bridge might be considered functionally obsolete if it doesn’t have any emergency shoulders.
These bridges, while not a danger, might still be the source of traffic jams because they are outdated, according to National Bridges.
D.C. again ranks high here. According to analysis, D.C. has the greatest percentage of functionally obsolete bridges in the country, with more than 63 percent of its bridges falling into this category.
Next comes Massachusetts, with more than 42 percent of its bridges listed as functionally obsolete. In Hawaii, number three on the list, more than 37 percent of bridges are obsolete.
Minnesota boasts the lowest percentage of functionally obsolete bridges, with just 3.17 percent of the state’s bridges falling into this category. In South Dakota, 3.85 percent of bridges are functionally obsolete, while in Iowa that percentage stands at 4.30 percent, third place on the list.
States taking action to repair bridges
Not all states are watching their bridges age. Many are actively building new ones. For instance, the American Road & Transportation Builders Association reported that in Utah — tops on the list — 13.82 percent of state bridges have been built during the last 10 years.
In second-place Nevada, 12.21 percent of the state’s bridges have been built in the last decade. Minnesota rounds out the top three, with 12.03 percent of its bridges built during the last 10 years.
Hawaii, though, has seen the fewest new bridges built in the last 10 years, with only 1.86 percent of its bridges built during the last decade. In second-place finisher Connecticut, this figure stands at 3.39 percent. California, which finished third on this list, saw just 4.25 percent of its bridges built in the last 10 years.
- About the Author
- Latest Posts

Michael Giusti is a senior insurance analyst, business journalist, and university professor with over 20 years of experience. He serves as department chair at Loyola University New Orleans and contributes to Insurance Thought Leadership, U.S. News, and other leading financial outlets.
