When Did You Last See a Doctor?
For many Americans, an annual checkup is a rigid ritual, however healthy they may be. Submitting to a battery of familiar tests, these patients view their yearly visits as an important precaution, either to track an existing ailment or catch a new one before it’s too far advanced.
These annual exams are more controversial than one might imagine: In the medical community, significant debate continues about their usefulness. Additionally, in an era of rising health insurance costs, these physicals are the subject of much confusion about coverage. While many believe the Affordable Care Act requires insurers to cover the costs of yearly checkups, the fine print is actually far more complicated. Financial concerns aside, some people simply fall prey to procrastination in medical matters. They finally go to the doctor when in pain, rather than in the name of prevention – this sometimes is determined by the health insurance coverage an individual has.
In this project, we set out to study how often Americans really visit their physicians – and their reasons for delaying if they do so. To tackle this subject, we used data from the Centers for Disease Control and Prevention’s Behavioral Risk Factor Surveillance System, a massive survey of the country’s health concerns and habits. Our findings reveal how many of us are putting off crucial care and common motives for avoiding the doctor’s office. Ready to learn how your health care routine compares to that of most Americans? Read on to find out.
Rain Check for the Checkup
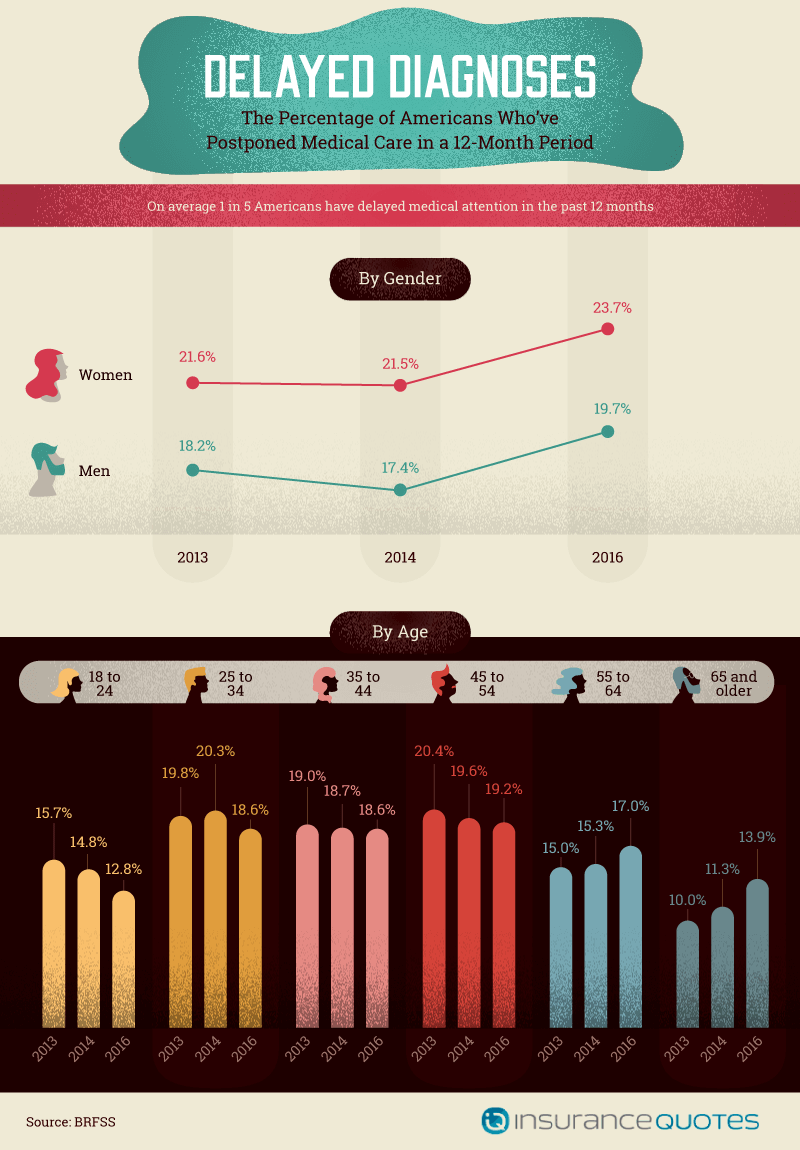
As our data make plain, a large portion of the American public has put off some form of medical care over the past year – a trend that’s increased of late. The percentage of men and women who delayed seeing a doctor spiked noticeably in 2016, after a small dip in 2014 figures. Interestingly, men were less likely to postpone care than women. That statistic is particularly troubling in light of some important recommendations related to women’s health specifically, such as regular mammogram screenings.
Within the general trend toward delaying care in 2016, however, Americans of different ages demonstrated significant variation. Among those 65 and older, for example, the percentage delaying care increased over each year studied. The same pattern emerged for the 55 to 64 age group as well. Conversely, the reverse was true for our youngest cohorts, with the percentage of those delaying care declining each year for those aged 18 to 24 and 25 to 34. Ironically, experts suggest annual care may be most important for baby boomers, who are particularly likely to have illnesses such as hepatitis C in addition to issues stemming from aging.
Having an affordable health insurance plan can help in situations where you may otherwise be hesitant to see a health care provider.
Stalling Care by State
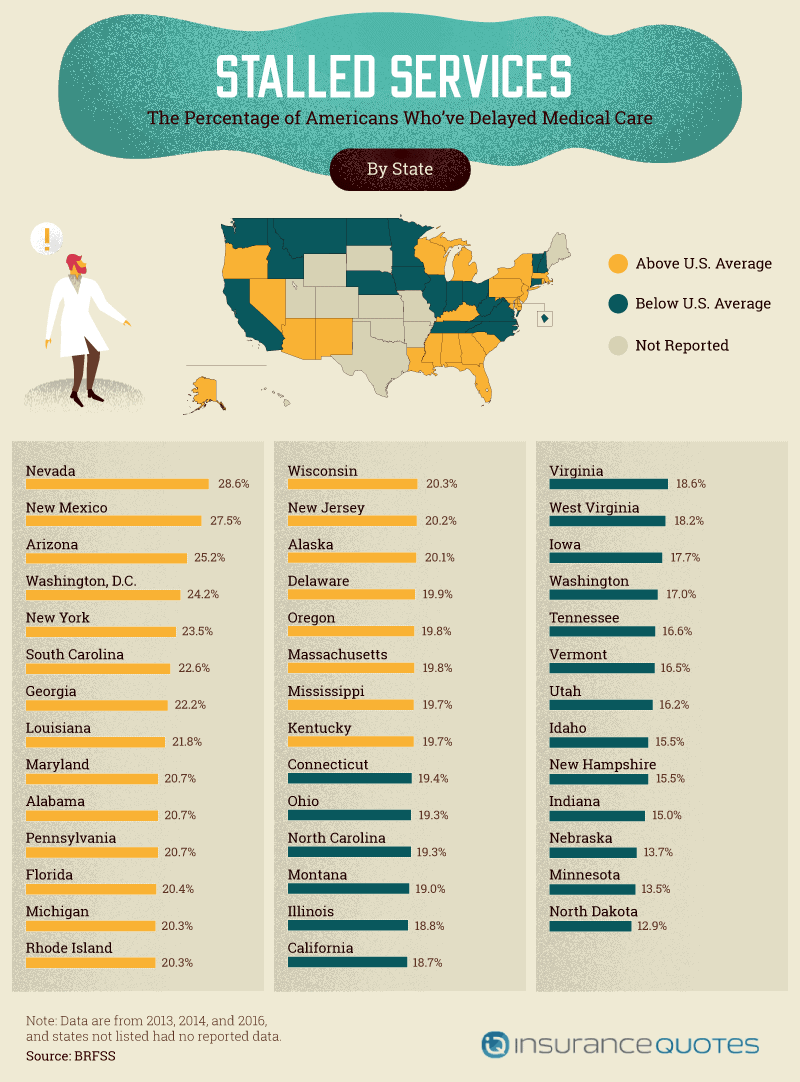
When we considered the proportion of residents in each state delaying care, some regions seemed particularly prone to procrastination. Indeed, in much of the Deep South – from Florida to Louisiana – more than 1 in 5 adults had put off visiting a doctor in the last year. The Southwest and Northeast were other hotbeds of health care delay, although there was sometimes wide variation between states in close proximity. For instance, California’s rate was lower than the national average, but all three states on its borders had above-average percentages, including Nevada, the nation’s highest.
Conversely, Midwestern and Northwestern states tended to see their physicians with more frequency. Some of the states with the lowest rates of delaying doctors’ visits have been celebrated for the general well-being of their residents, such as Minnesota. This correlation was far from consistent, however. In fact, New York and New Jersey are regarded as healthy states by most measures, although each had an above-average percentage of residents putting off medical care.
Passing on Prevention
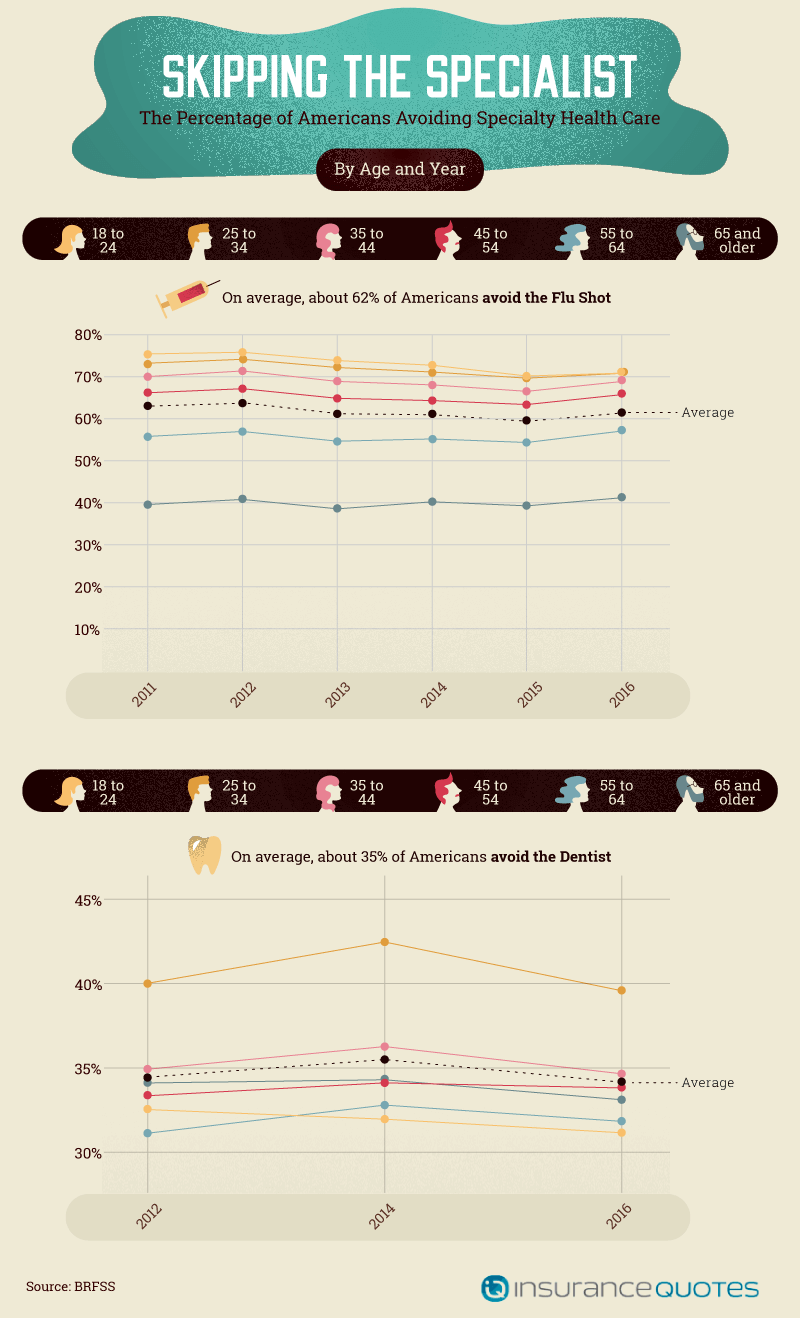
While there’s some debate about the value of an annual general practitioner visit, the medical community is more agreed on the frequency necessary for specific medical services. Among dentists, for instance, a biannual appointment schedule is a standard recommendation. However, according to our findings, more than a third of Americans are avoiding dental care. That rate was even higher among those aged 25 to 34, with roughly 4 in 10 putting off a dentist appointment.
Rates of delay were even higher for another specialized kind of care: the flu shot. While the CDC recommends every adult get one each year, the majority of Americans don’t do so. In this regard, however, the proactive approach became more prevalent with age. There’s good reason for each successive age group to avoid vaccination less, as the risks associated with the flu increase with age.
Which States Skip the Shot?
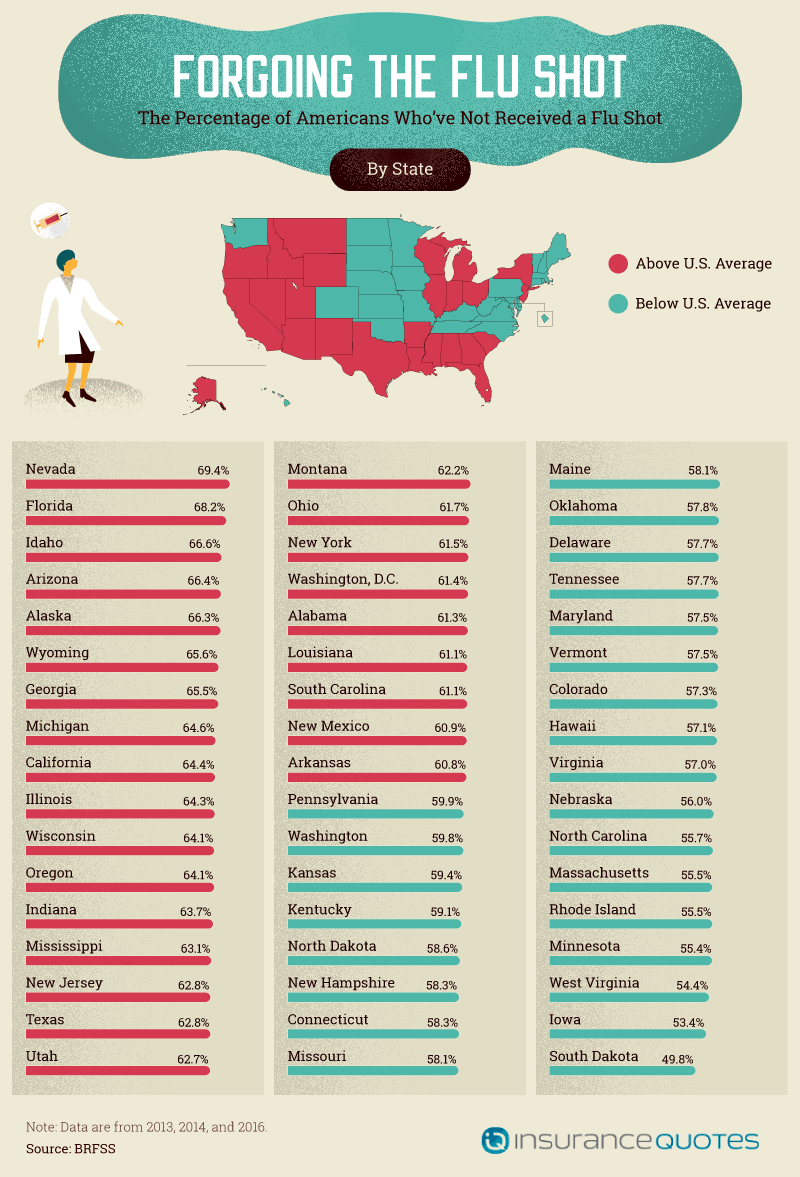
In the geography of flu prevention, Middle America had the most impressive record. Throughout much of the heartland, a relatively low percentage of residents had skipped their shot. South Dakota was a particular standout in this area, as the only state in which more than half the population received a flu vaccination. The Mid-Atlantic seaboard also boasted an admirable record, with states such as Maryland and Virginia seeing less than 60 percent of residents going without their shot.
Vaccination record. In places such as Nevada, Idaho, and Wyoming, roughly two-thirds of residents did not receive a flu shot. The Midwest also witnessed relatively sparse vaccination, with particularly large portions of Michigan, Illinois, and Wisconsin skipping the shot. The Northeast boasted a relatively good record overall, though low rates in New York and New Jersey were conspicuous outliers.
Cause of Postponing Care
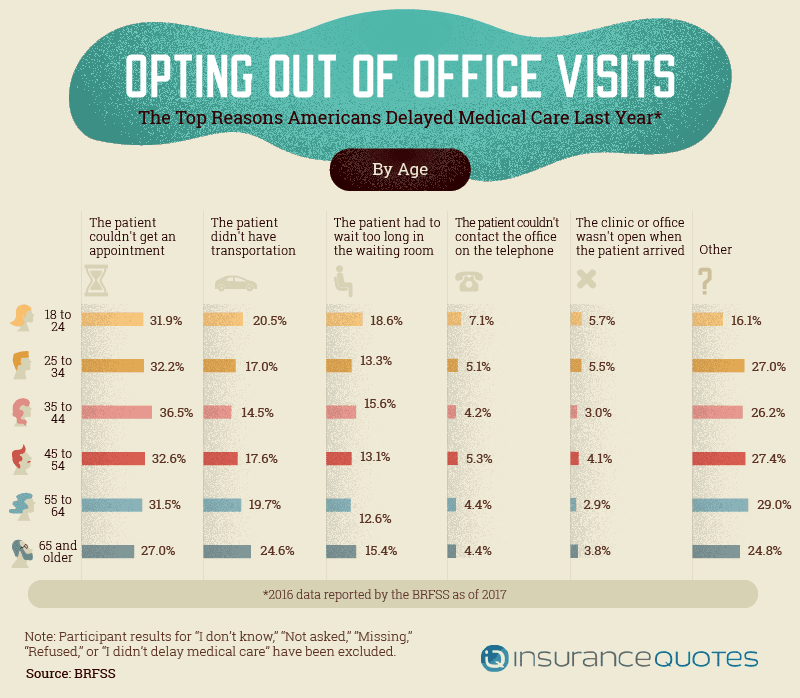
While Americans put off doctor visits for a myriad of reasons, the most common may be scheduling difficulty. Indeed, roughly a third of all age groups younger than 65 said they had trouble getting an appointment suited to their schedules. This statistic resonates with recent research suggesting patients now wait an average of 24 days to schedule appointments in major cities. This percentage declined slightly for those 65 and older, perhaps because they’re more likely to be retired – and thus have more flexible schedules. Conversely, transportation concerns were most common in this oldest age group, likely because driving becomes difficult for many older Americans.
Others had no problem getting to their doctors’ locations but were deterred by the wait they encountered upon arrival. This finding confirms the results of a recent survey, in which patients identified the time spent waiting as the most stressful aspect of their appointments. A smaller percentage couldn’t get through to doctors or their staff by phone or found the office closed once they arrived.
Postponing Over Price
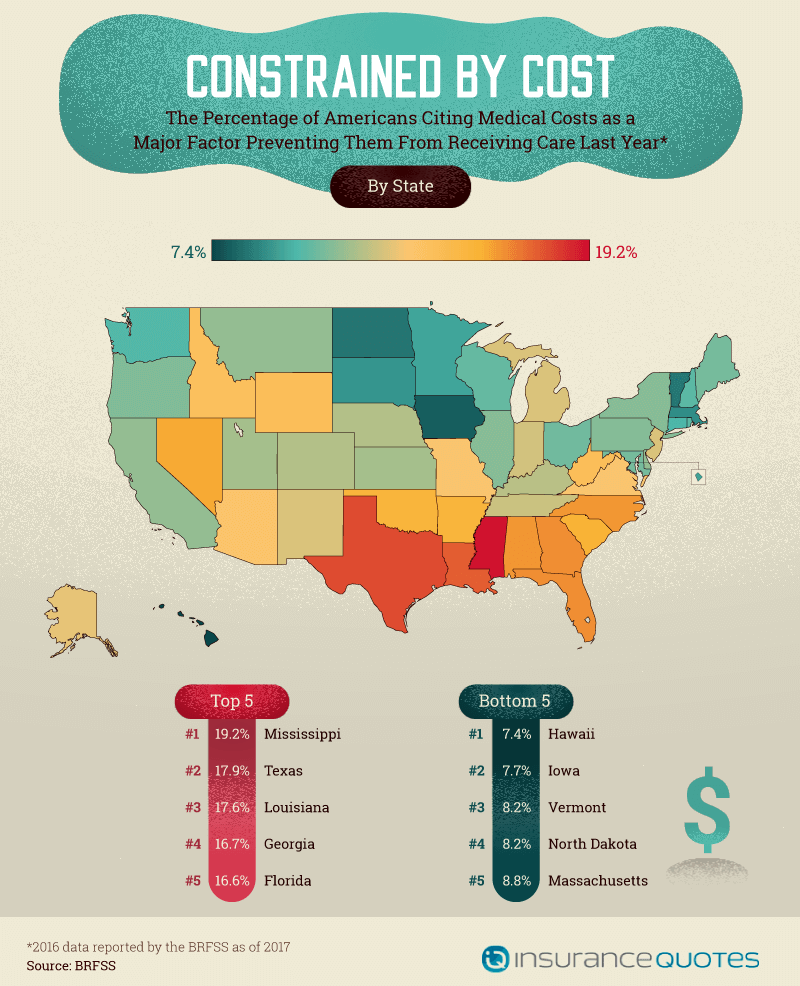
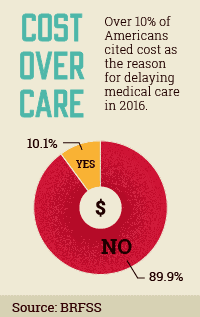
In addition to the logistical challenges described above, over 1 in 10 Americans identified the cost of health care as the central reason for not seeing a doctor.
This trend was particularly visible throughout much of the South, with nearly 1 in 5 residents delaying for this reason in states such as Mississippi and Texas.
Experts have increasingly warned that the prices of common medical services are dissuading patients from seeking the help they need. And price isn’t just stopping those without insurance coverage.
This is even true for many with insurance, as high-deductible plans become more popular.
In some states, however, the costs of care seemed less problematic. While Hawaii has been called America’s most expensive state, it boasted the lowest percentage of residents avoiding medical care due to financial concerns.
Massachusetts and Vermont may not be surprised by their inclusion in the bottom five, as they earned the first and third spots in a recent ranking of the best states for health care access.
Demographics of Delaying Care
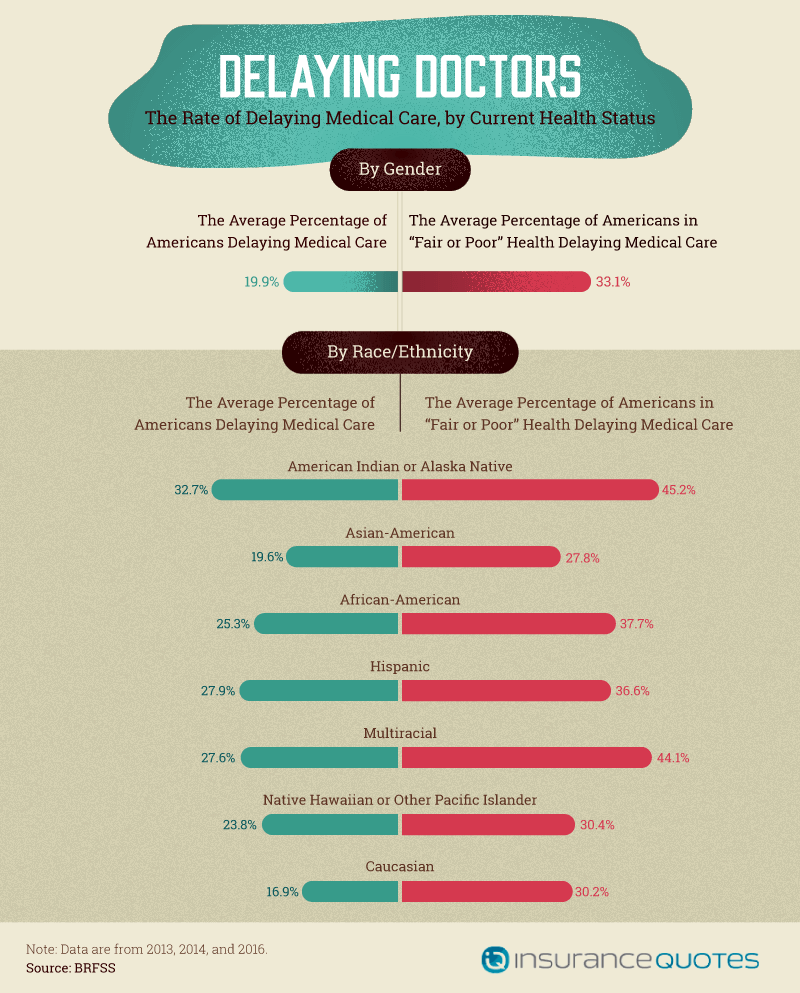
While one might assume healthy Americans were most comfortable skipping checkups, our data reveal that’s not the case. In fact, 35.4 percent of women in fair or poor health delayed care, relative 21.8 percent of women overall. This gap was present to a slightly lesser extent for men, with 30.6 percent of men in fair or poor health delaying care, as opposed to 18 percent on average.
Among ethnic groups, American Indian or Alaska Natives were the most likely to delay medical care. This reality may contribute to persistent health concerns for this demographic, including lower life expectancies and a disproportionately high disease burden. Hispanic, multiracial and African-Americans also had high rates of delayed care, especially among those with fair or poor health. Caucasian Americans were the least likely to postpone medical care, although they also did so much more often when in fair or poor health.
Removing Barriers to Better Care
While well-being is a top priority for many Americans, our findings reveal just how hard it can be to make room for the care you need. Whether hindered by busy schedules or the high price of an appointment, many patients confront significant challenges in seeing their doctors. If it’s been some time since you last saw a medical professional, don’t feel discouraged from turning that trend around. As our data make clear, delaying care is more common than you might assume – but fear of judgment shouldn’t be the reason you do so.
If cost or coverage concerns are keeping you from obtaining medical care, let insuranceQuotes.com be a part of your solution. With a ton of health care tips and insurance resources tailored to your individual needs, we’ll help you find the coverage you and your family need, all at the lowest price possible.
Methodology
We collected data from the Centers for Disease Control and Prevention’s Behavioral Risk Factor Surveillance System. The CDC operates a public domain website, offering direct access to important medical data, research, and guidelines. The BRFSS is the leading government survey of public health data in the United States, consisting of more than 400,000 interviews conducted telephonically with residents of all 50 states.
The BRFSS data we utilized in this project rely on self-reported information by interview participants. There are many issues with self-reported data. These issues include but are not limited to: selective memory, telescoping, attribution, and exaggeration.
Fair Use Statement
Want to urge your audience to see a doctor more often? You’re welcome to use our findings and images for noncommercial purposes. If you do, please provide a link to this page to attribute insuranceQuotes.com appropriately – giving credit where it’s due is a healthy habit.
- About the Author
- Latest Posts

Lauren Pezzullo is an insurance content strategist and consumer trends analyst. She has led editorial teams at major brands and written for the Center for Health Communication at UT Austin. Her work covers home, auto, and health insurance topics.
