The Great Health and Wealth Divide

At the end of 2015, close to 29 million working-aged Americans lived without health insurance.
While the Affordable Care Act has reduced the percentage of uninsured Americans, nearly 12 percent of people between the ages of 18 and 64 in the United States are still not covered. For almost half of those without insurance today, cost was identified as the primary reason. Unfortunately, living without health insurance can be even more costly if − or when – you ever need care.
Despite advances in our health care system and the fact that Americans today are living longer than ever before, the health gap between top earners in the U.S. and those living in poverty is still pronounced. We examined data from the Health Inequality Project to better understand the effect of wealth on the average life expectancy in America and compared it to the rest of the world.
Here’s what we learned.
The (High) Cost of Life
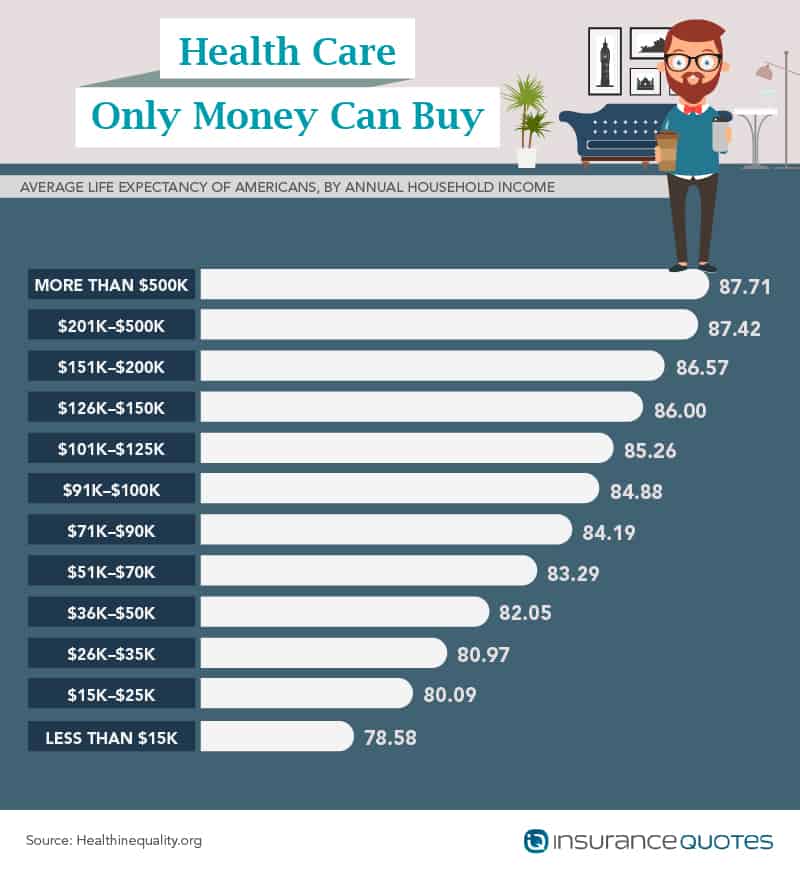
Many diverse factors can contribute to one’s overall life span, such as predisposed health conditions and access to quality care. Undeniably, income also impacts the average life expectancy in the United States.
Across the country, those making less money averaged shorter life spans than those who made more. Almost 10 years of life separates the most impoverished people in America from the wealthiest. Those earning $15,000 or less a year in annual household income had an average life expectancy of fewer than 79 years – compared to those making $10,000 more who lived 1.5 years longer.
These increases continued with each bracket of annual household income (up to $500,000 a year or more, who lived almost 88 years on average). With the average household earning just more than $51,000 a year, most Americans are living a shorter life span due in part to their financial status.
If you need help to find affordable health insurance, iQ is here to help.
Inequality Levels, by State
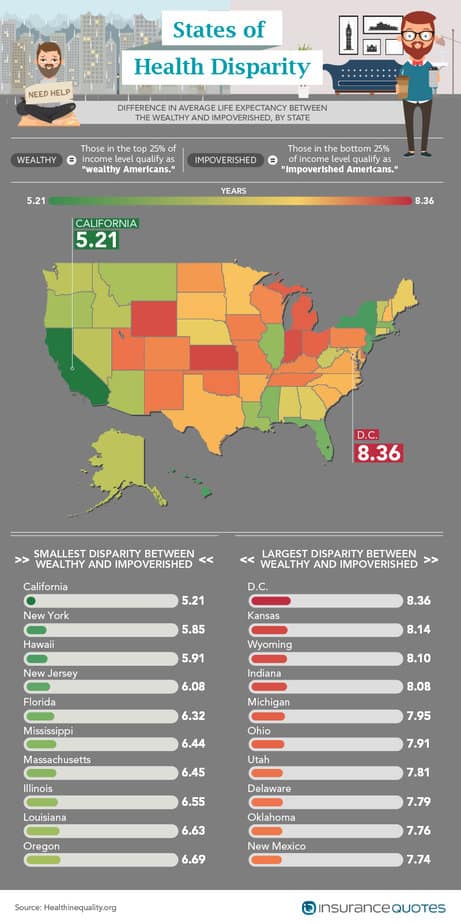
Some states have higher disparities in life expectancy between the wealthy and poor than others. D.C., Kansas, Wyoming and Indiana had the largest gaps in life spans, averaging more than eight years between those earning the most and those earning the least. D.C., in particular, has one of the highest unemployment rates in the country.
While D.C. residents earn almost $20,000 per household more than the median income in the United States, differences in life expectancy between the rich and impoverished are widest here.
Comparatively, California, New York and Hawaii had the smallest gap in life expectancy. While these states have above-average incomes, California and New York also have some of the highest sales of organic foods in the U.S. Higher sales and increased consumption of organic food suggest a higher rate of overall nutrition.
While nutrition may not seem like a significant factor in life expectancy, it directly impacts diseases and associated risks, such as obesity, that account for some of the highest morbidity rates in the country. Increased access to healthier foods for less money provides necessary nutrition to people, which can help keep them alive longer.
Low Life Expectancies
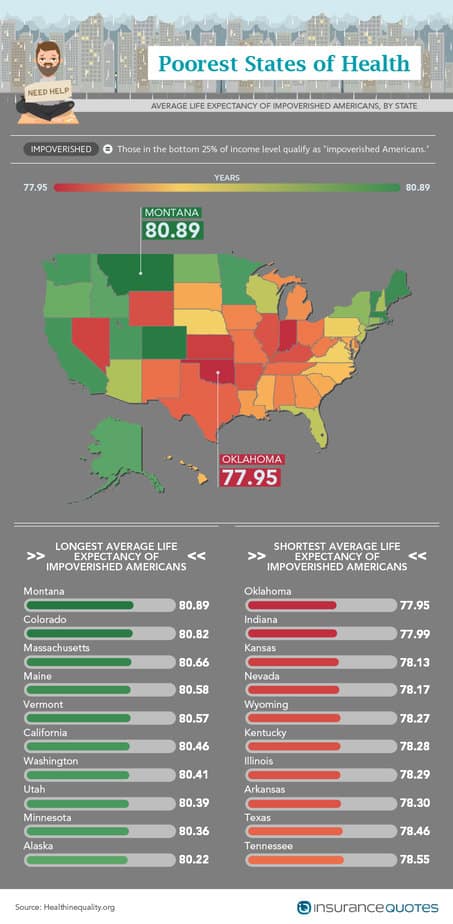
Some states also reported the shortest life expectancies for impoverished Americans. In Oklahoma and Indiana, the average life span for the most impoverished people is less than 78 years. In Kansas and Nevada, the life expectancy is a little more than 78 years.
Alternatively, states like Montana, Colorado and Massachusetts reported the longest average life spans among their poorest residents. Unfortunately, with less than three full years between life expectancies among the impoverished in Oklahoma (the lowest) and Montana (the highest), the severity of the health gap in the nation becomes clearer.
While some states ultimately reported higher or lower average life spans, it’s obvious this problem is symptomatic across the country. Addressing issues associated with this divide – such access to quality health care, reasonably priced health insurance and other manageable variables like drug abuse and violence – can equate to additional years of quality life for every citizen, regardless of income.
Average Life Expectancy, by Gender
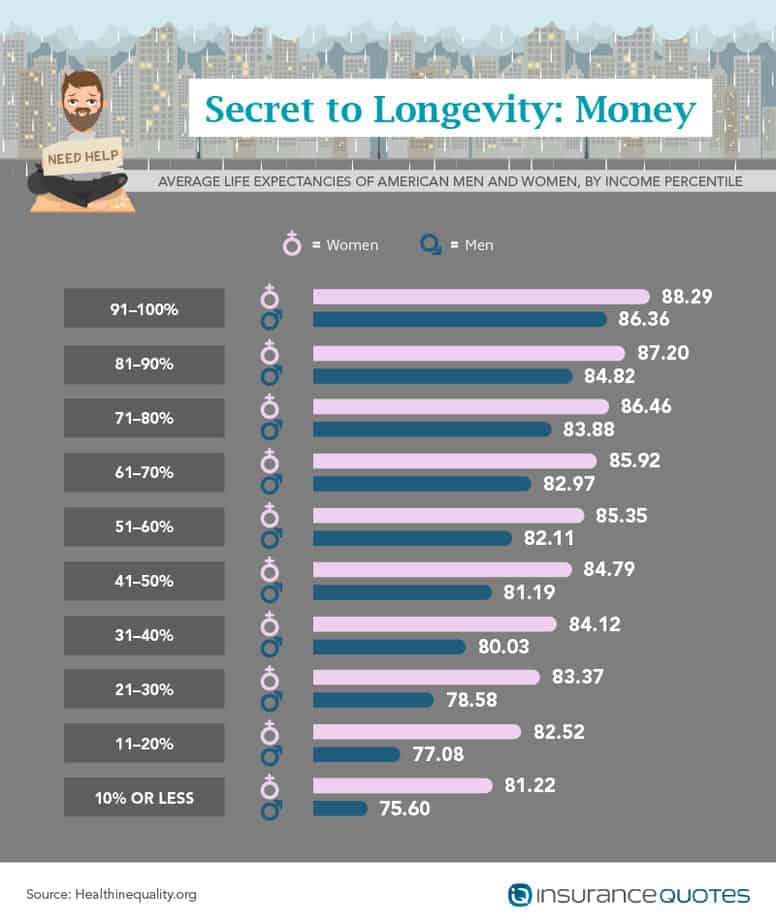
While women have historically lived longer than men, this is especially true among those earning less in the nation.
For those in the top 10 percent of income earnings in the United States, there are less than two years between the average life expectancies of men and women. That gap widens considerably across lower-earnings brackets. Those in the bottom 10 percent (or less) of household earnings in the country have almost a six-year gap between men and women – with men (on average) only living to 76 years old.
Average Life Expectancy Worldwide
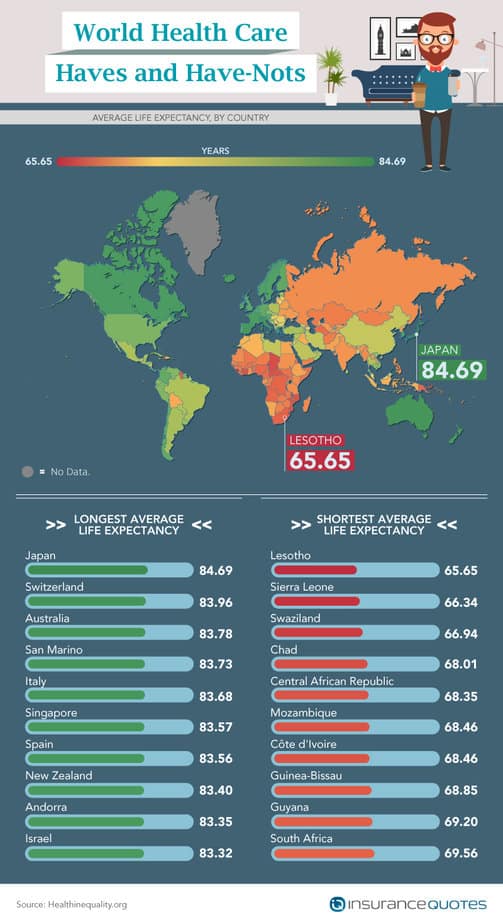
Across the world, Japan has the longest average life expectancy of any country (almost 85 years) and joins countries such as Switzerland, Australia and San Marino in highest global lifetimes. While identifying the exact reasons for Japan’s elongated life expectancy can be challenging, research has attributed some of the country’s longer life spans to clean diets and simplified health care systems for the elderly, which focus on their quality of life rather than extending it.
The U.S. did not rank in the top 10 countries for longest average life expectancies.
Countries with the lowest average life expectancies were largely African and Asian, located in significantly impoverished parts of the developing world. Lesotho, in Southern Africa, has the lowest average life span – less than 66 years. Compared to Japan, that’s almost a 20-year difference. While dramatic, these gaps showcase the value of wealth in establishing successful health care, particularly in rural regions where resources are especially scarce.
Life Expectancies of Men and Women Worldwide
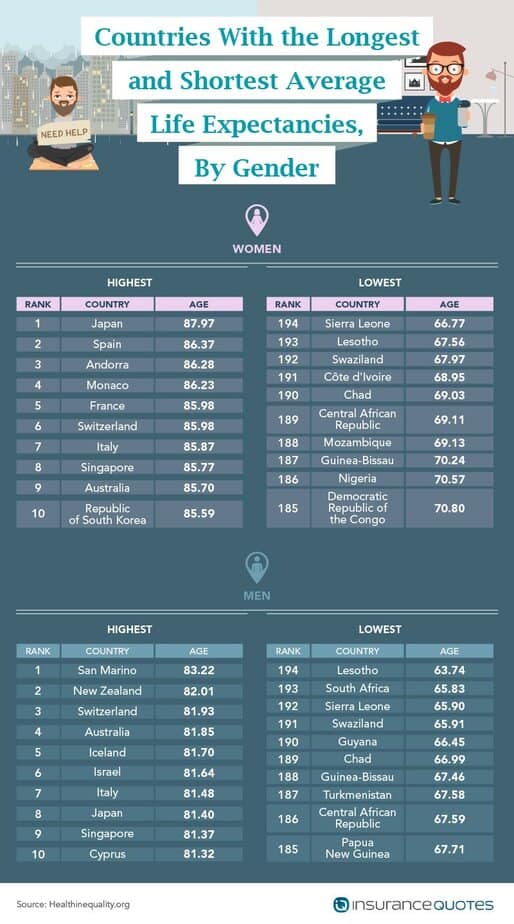
Life expectancies vary by gender, internationally as well as domestically. For women, the highest average life spans are in Japan (nearly 88 years), Spain and Andorra (more than 86 years each). For men, countries such as San Marino (more than 83 years), New Zealand (82 years), and Switzerland (almost 82 years) have the highest lifetime averages.
Sub-Saharan and West African regions make up the bulk of countries with the lowest average life expectancies for both women and men – Sierra Leone for women (less than 67 years) and Lesotho for men (less than 64 years).
For sub-Saharan regions, the effects of the HIV and AIDS epidemic – coupled with a poorly funded health care system – rank it as one of the worst places in the world for health and health care. Similarly, in West Africa, the Ebola crisis ravaged the health care system, but provided countries, like Sierra Leone, with a surge of financial aid that may, at least temporarily, boost the residents’ quality of care.
Unfortunately, for these developing nations, the financial support clearly required to build a successful infrastructure for medical care comes in times of complete crisis.
Closing the Health Care Gap
In the United States and around the world, money and income directly impact the quality of health care and average life expectancies in those areas. Regardless of existing statewide or even national health equality programs in the nation, less income often means shorter life spans.
The Affordable Care Act of 2010 was a step in the direction of closing the gap between wealth and health in America. Visit us online today to see what your subsidy payments under Obamacare would look like, and use our online calculator to compare these costs to dozens of other health insurance providers and options. At InsuranceQuotes.com, we provide access to the widest network of carriers and agents in the country – and that means finding the best insurance policy for you and your family, plain and simple.
Methodology
We pulled all data from healthinequality.org/data. For the graphic titled “States of Health Disparity,” we looked at the average life expectancy for the top 25 percent income levels and subtracted that value by the lowest 25 percent income levels. For the graphic titled “Poorest States of Health,” we only looked at the average life expectancy for the lowest 25 percent income levels.
Sources
- https://healthinequality.org/data/
- https://www.cdc.gov/nchs/data/nhis/earlyrelease/insur201609.pdf
- https://www.advisorperspectives.com/dshort/updates/2016/10/14/median-household-income-by-state-a-new-look-at-the-data
- http://news.harvard.edu/gazette/story/2016/02/money-quality-health-care-longer-life/
- http://money.cnn.com/2013/09/17/news/economy/poverty-income/
- http://www.bls.gov/news.release/pdf/srgune.pdf
- https://www.advisorperspectives.com/dshort/updates/2016/10/14/median-household-income-by-state-a-new-look-at-the-data
- http://www.ecowatch.com/these-10-states-account-for-a-whopping-78-in-sales-of-organic-food-1882106375.html
- http://www.npr.org/sections/thesalt/2016/02/18/467136329/is-organic-more-nutritious-new-study-adds-to-the-evidence
- http://ajcn.nutrition.org/content/98/2/620.full
- https://www.cdc.gov/obesity/data/adult.html
- http://phys.org/news/2016-06-women-longer-men.html
- http://www.nbcnews.com/news/asian-america/japan-has-highest-life-expectancy-any-major-country-why-n130871
- http://www.wsj.com/articles/africa-struggles-to-rebuild-its-ravaged-health-care-system-1433457230
- http://data.worldbank.org/indicator/SP.DYN.LE00.IN?locations=US
Fair Use Statement
Feel free to use these images to spread awareness about health equality. But do the right thing, and give the author credit by linking back to this site.
- About the Author
- Latest Posts

Lauren Pezzullo is an insurance content strategist and consumer trends analyst. She has led editorial teams at major brands and written for the Center for Health Communication at UT Austin. Her work covers home, auto, and health insurance topics.
